大家经常对ggplot2中的图例不满意,想要各种修改,今天就介绍下图例的各种修改细节,基本上常用的操作都涉及到了!
library(ggplot2)
library(gcookbook)
提供3种方法可以在ggplot2中移除图例。
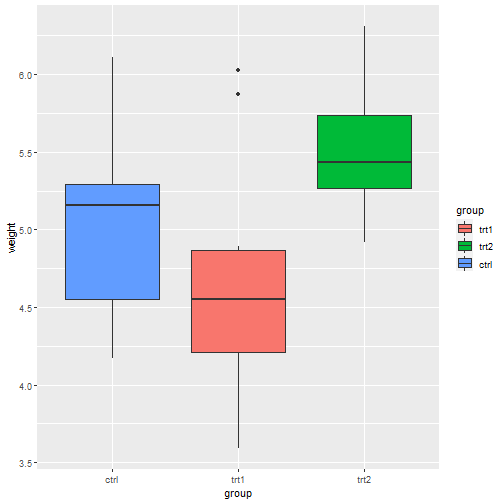
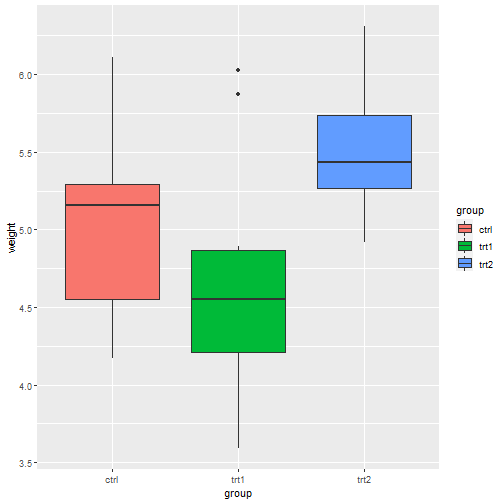
# 基本图形
pg_plot <- ggplot(PlantGrowth, aes(x = group, y = weight, fill = group)) +
  geom_boxplot()

pg_plot

# 首先可以使用guides()函数移除图例
pg_plot +
  guides(fill = "none")

然后可以在scale_**函数中移除,这里是fill,你要根据自己的情况换成shape、color等。
pg_plot+scale_fill_discrete(guide = "none")

第3种方法是在theme中移除。
pg_plot+theme(legend.position = "none")
也是在theme中更改,
pg_plot <- ggplot(PlantGrowth, aes(x = group, y = weight, fill = group)) +
  geom_boxplot() +
  scale_fill_brewer(palette = "Pastel2")

pg_plot +
  theme(legend.position = "top") # 放在顶部
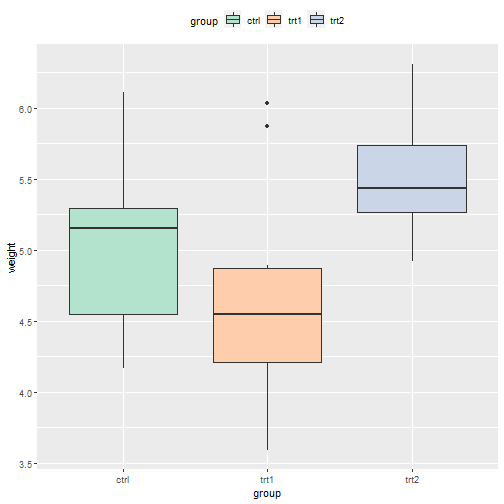
legend.position的参数可以是left、right、top、bottom,还可以是坐标。
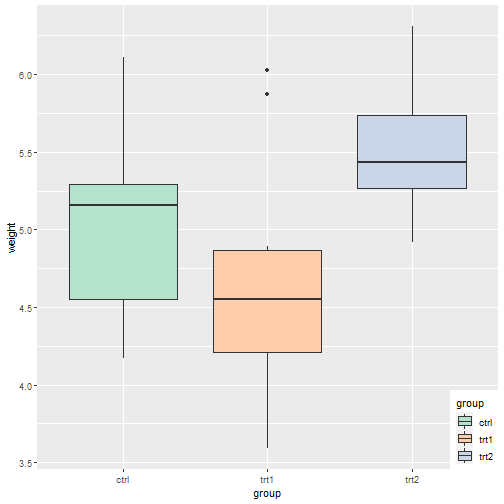
pg_plot+theme(legend.position = c(0.8,0.3))

在ggplot2中,左下角的坐标是c(0,0),右上角的坐标是c(1,1),你可以自己设置想要放置的位置。需要注意的是,你设置的这个坐标是图例中心点的坐标,可以通过legend.justification设置图例的哪个位置放在你的坐标上。
# 图例右下角,放在画布右下角
pg_plot +
  theme(legend.position = c(1, 0), legend.justification = c(1, 0))
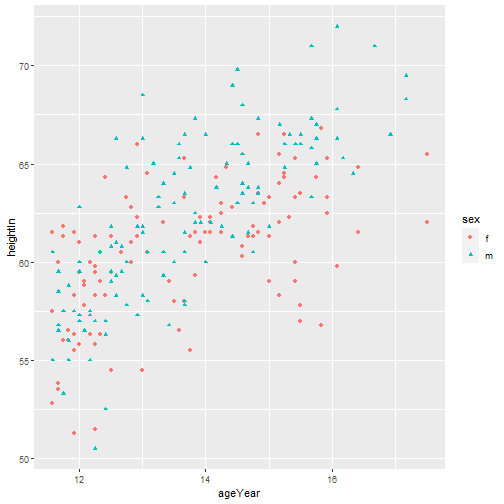
p <- ggplot(heightweight, aes(x=ageYear, y=heightIn, shape=sex, colour=sex))+geom_point()
p
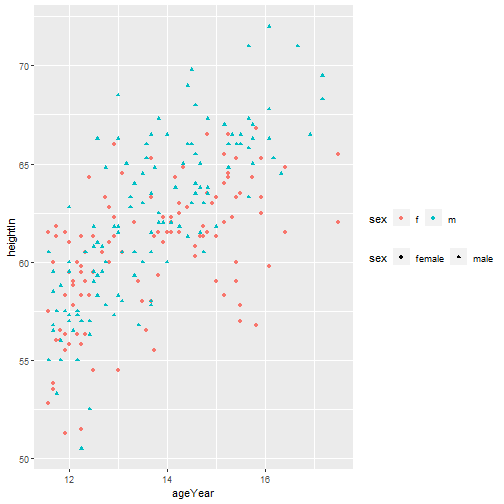
两个图例更改为水平排列:
p + scale_shape_discrete(label = c("female","male")) +
  theme(legend.direction = "horizontal")
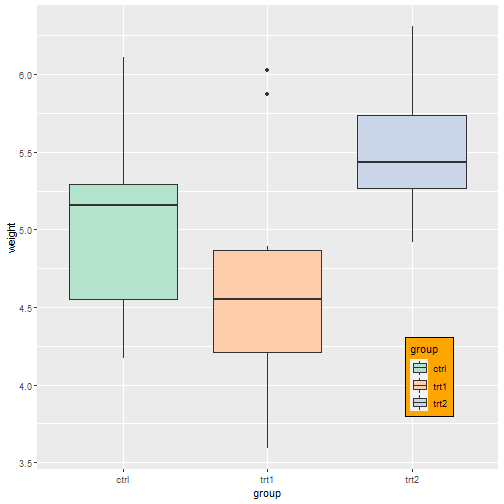
pg_plot+
  theme(legend.position = c(0.85,0.2))+
  theme(legend.background = element_rect(fill = "orange",color = "black"))
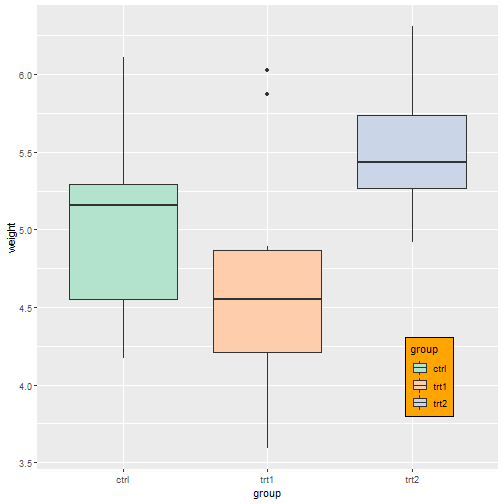
中间还有一部分是白色,需要另外一个参数修改:
pg_plot+
  theme(legend.position = c(0.85,0.2))+
  theme(legend.background = element_rect(fill = "orange",color = "black"),
        legend.key = element_rect(fill = "orange")
        )
pg_plot <- ggplot(PlantGrowth, aes(x = group, y = weight, fill = group)) +
  geom_boxplot()

pg_plot

# limits
pg_plot +
  scale_fill_discrete(limits = c("trt1", "trt2", "ctrl"))
也可以在画图之前,通过因子化的方法把数据先排好序再画图哦。
2种方法。
pg_plot+scale_fill_discrete(guide = guide_legend(reverse = T))

pg_plot+guides(fill = guide_legend(reverse = T))

2种方法。
pg_plot <- ggplot(PlantGrowth, aes(x = group, y = weight, fill = group)) +
  geom_boxplot()

pg_plot

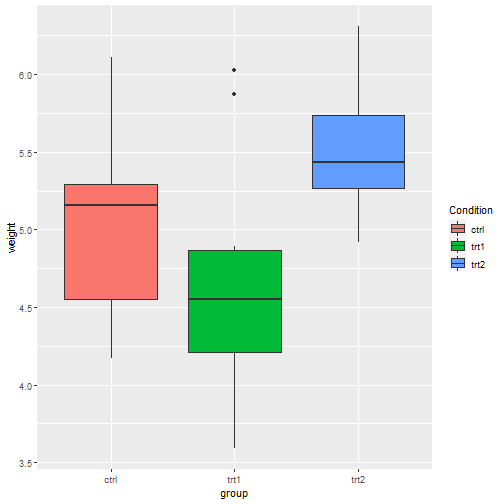
labs里面修改
pg_plot + labs(fill = "Condition")
在scale_*函数里面修改。
pg_plot+scale_fill_discrete(name = "hahah")

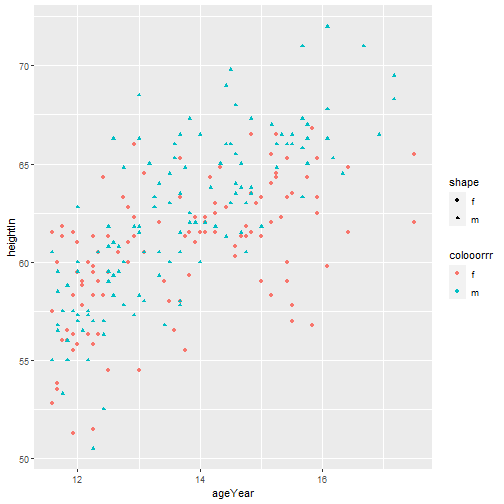
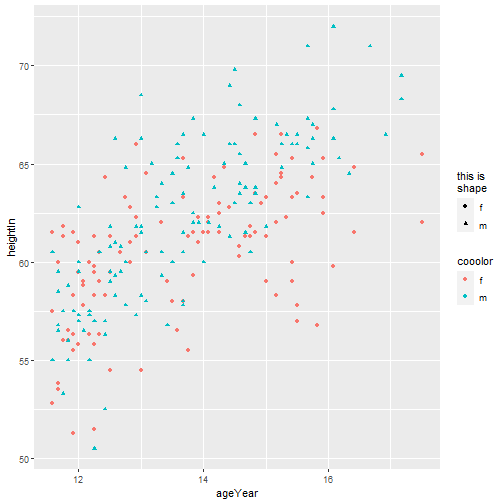
还有一种比较复杂的情况,如果多个一个变量映射给多个图形参数,或者有多个图例,怎么修改呢?像下面这个例子,sex和shape、color都有关。
p <- ggplot(heightweight, aes(x=ageYear, y=heightIn, shape=sex, colour=sex))+geom_point()
p

可以在scale_*函数中修改:
p + scale_shape_discrete(name = "shape")+
  scale_color_discrete(name = "colooorrr")
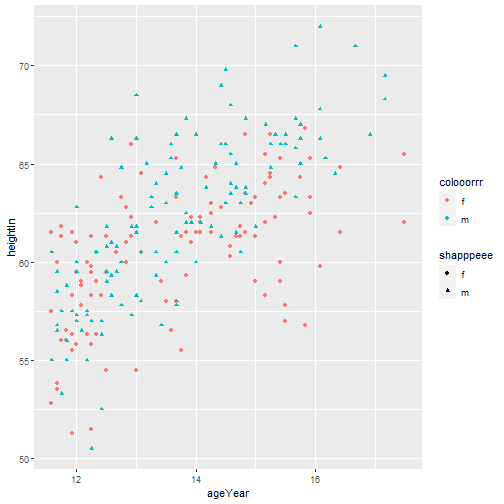
也可以在legend中修改:
p + labs(shape = "shapppeee",color = "colooorrr")
还可以在guides函数中修改:
p + guides(shape = guide_legend(title = "this is\nshape"),
           color = guide_legend(title = "cooolor")
           )
pg_plot <- ggplot(PlantGrowth, aes(x = group, y = weight, fill = group)) +
  geom_boxplot()
pg_plot
可以在theme中修改:
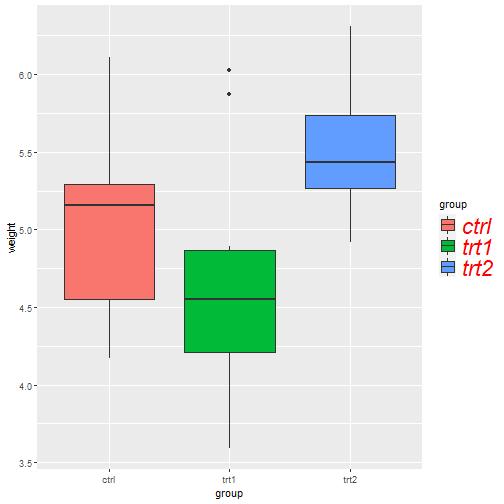
pg_plot + theme(
  legend.title = element_text(
    face = "italic",
    family = "Times",
    colour = "red",
    size = 18
  )
)

也可以在guides中修改:
pg_plot +
  guides(fill = guide_legend(title.theme = element_text(
    face = "italic",
    family = "Times",
    colour = "red",
    size = 14))
  )

pg_plot

可以在theme中修改,也可以在scale_xxx函数中修改,也可以在guides函数中修改。
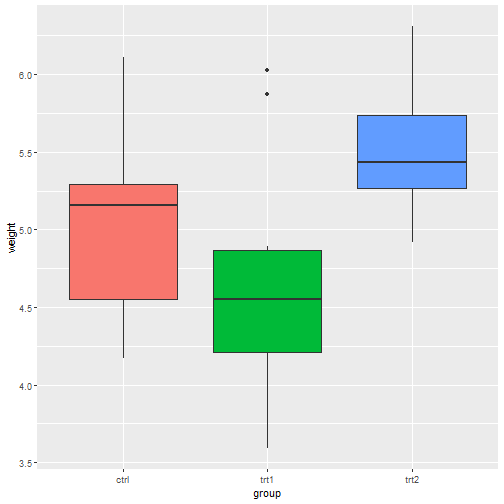
pg_plot+theme(legend.title = element_blank())

pg_plot+scale_fill_discrete(name = NULL)

pg_plot+scale_fill_hue(guide = guide_legend(title = NULL))

pg_plot+guides(fill = guide_legend(title = NULL))

pg_plot

pg_plot+scale_fill_discrete(labels = c("label1","label2","label3"))
在theme中修改:
pg_plot +
  theme(legend.text = element_text(
    colour = "red",
    face = "italic",
    size = 22)
  )