现网上运行着一个自己开发的 metrics exporter,它是专门来捕获后端资源的运行状态,并生成对应的 prometheus metrics 供监控报警系统使用。当然这个 exporter 只是负责远程监控资源,并不能实际控制后端的资源,也不能实时动态获得被监控的资源的变动事件。当我们的运维小伙伴手动错误删除后端被监控的资源,导致业务流量异常。此时也没有报警出来,而这个报警却是依赖这个 metrics exporter 所采集的数据,导致了一次小型事件。因为这个事件,才有今天写文章的动力,同时也分享下解决这个问题的方法。

通过跟小伙伴们一起复盘,以及追查可能出现问题的位置后,大家都觉得没有任何问题。在运维删除对应的监控资源后,同时没有关闭报警规则的情况下,应该有大量的任何异常报警产生。但实际情况,没有任何报警发出来。
当大家一筹莫展的时候,我突然说了一句,会不会是数据采集出现了问题?大家眼前一亮,赶紧拿出 metrics exporter 的代码检查。通过反复检查,也没有发现可疑的地方,于是大家又开始了思考。这时我打开了 metrics exporter 调试模式,打上断点,然后请运维小伙伴删除一个测试资源,观察监控数据的变化。果不其然,资源删除了,对应监控的 metrics 条目的值没有变化(也就是说,还是上次资源的状态)。
这下破案了,搞了半天是因为 metrics 条目内容没有跟随资源的删除而被自动的删除。导致了报警系统一直认为被删除的资源还在运行,而且状态正常。
既然知道了原因,再回过头看 metrics exporter 的代码,代码中有 prometheus.MustRegister、prometheus.Unregister 和相关的 MetricsVec 值变更的实现和调用。就是没有判断监控资源在下线或者删除的情况下,如何删除和清理创建出来的 MetricsVec。
在我的印象中 MetricsVec 会根据 labels 会自动创建相关的条目,从来没有手动的添加和创建。根据这个逻辑我也认为,MetricsVec 中如果 labels 对应的值不更新或者处于不活跃的状态,应该自动删除才是。
最后还是把 golang 的 github.com/prometheus/client_golang 这个库想太完美了。没有花时间对 github.com/prometheus/client_golang 内部结构、原理、处理机制充分理解,才导致这个事件的发生。
github.com/prometheus/client_golang 中的 metrics 主要是 4 个种类,这个可以 baidu 上搜索,很多介绍,我这里不详细展开。这些种类的 metrics 又可以分为:一次性使用和多次使用。
注意这两者的区别,他们有不同的应用场景。
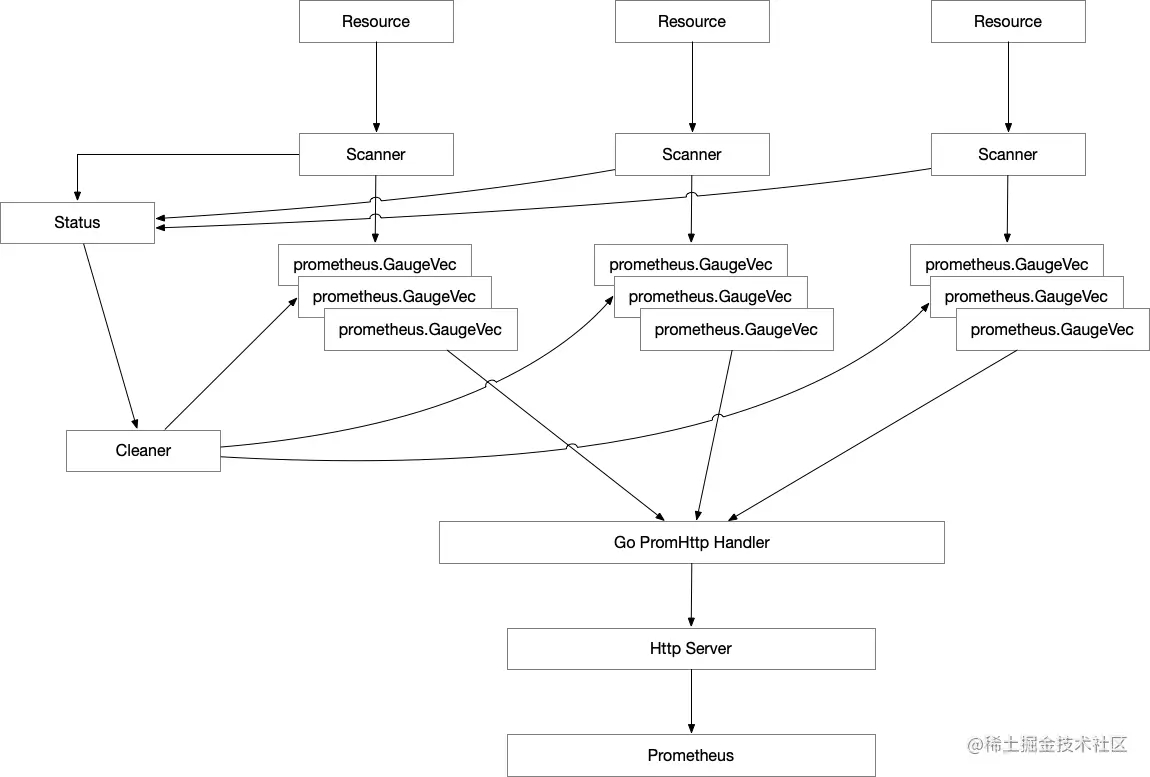
这次项目中写的 metrics exporter 本应该是采用 “一次性使用” 这样的模型来开发,但是内部结构模型采用了 “多次性使用” 模型,因为指标数据写入者和数据读取者之间没有必然联系,不属于一个会话系统,所以之间是异步结构。具体我们看下图:

从图中有 2 个身份说明下:
在此次项目中 metrics 条目是用 prometheus.GaugeVec 作为采集数据计算后结果的存储类型。
说了这么多,想要分析真正的原因,就必须深入 github.com/prometheus/client_golang 代码中 GaugeVec 这个具体代码实现。
// GaugeVec is a Collector that bundles a set of Gauges that all share the same
// Desc, but have different values for their variable labels. This is used if
// you want to count the same thing partitioned by various dimensions
// (e.g. number of operations queued, partitioned by user and operation
// type). Create instances with NewGaugeVec.
type GaugeVec struct {
	*MetricVec
}
type MetricVec struct {
	*metricMap
	curry []curriedLabelValue
	// hashAdd and hashAddByte can be replaced for testing collision handling.
	hashAdd     func(h uint64, s string) uint64
	hashAddByte func(h uint64, b byte) uint64
}
// metricMap is a helper for metricVec and shared between differently curried
// metricVecs.
type metricMap struct {
	mtx       sync.RWMutex // Protects metrics.
	metrics   map[uint64][]metricWithLabelValues  // 真正的数据存储位置
	desc      *Desc
	newMetric func(labelValues ...string) Metric
}
通过上面的代码,一条 metric 条目是保存在 metricMap.metrics 下。 我们继续往下看:
读取数据
// Collect implements Collector.
func (m *metricMap) Collect(ch chan<- Metric) {
	m.mtx.RLock()
	defer m.mtx.RUnlock()
	// 遍历 map
	for _, metrics := range m.metrics {
		for _, metric := range metrics {
			ch <- metric.metric // 读取数据到通道
		}
	}
}
写入数据
// To create Gauge instances, use NewGauge.
type Gauge interface {
	Metric
	Collector
	// Set sets the Gauge to an arbitrary value.
	Set(float64)
	// Inc increments the Gauge by 1. Use Add to increment it by arbitrary
	// values.
	Inc()
	// Dec decrements the Gauge by 1. Use Sub to decrement it by arbitrary
	// values.
	Dec()
	// Add adds the given value to the Gauge. (The value can be negative,
	// resulting in a decrease of the Gauge.)
	Add(float64)
	// Sub subtracts the given value from the Gauge. (The value can be
	// negative, resulting in an increase of the Gauge.)
	Sub(float64)
	// SetToCurrentTime sets the Gauge to the current Unix time in seconds.
	SetToCurrentTime()
}
func NewGauge(opts GaugeOpts) Gauge {
	desc := NewDesc(
		BuildFQName(opts.Namespace, opts.Subsystem, opts.Name),
		opts.Help,
		nil,
		opts.ConstLabels,
	)
	result := &gauge{desc: desc, labelPairs: desc.constLabelPairs}
	result.init(result) // Init self-collection.
	return result
}
type gauge struct {
	// valBits contains the bits of the represented float64 value. It has
	// to go first in the struct to guarantee alignment for atomic
	// operations.  http://golang.org/pkg/sync/atomic/#pkg-note-BUG
	valBits uint64
	selfCollector
	desc       *Desc
	labelPairs []*dto.LabelPair
}
func (g *gauge) Set(val float64) {
	atomic.StoreUint64(&g.valBits, math.Float64bits(val))  // 写入数据到变量
}
看到上面的代码,有的小伙伴就会说读取和写入的位置不一样啊,没有找到真正的位置。不要着急,后面还有。
// getOrCreateMetricWithLabelValues retrieves the metric by hash and label value
// or creates it and returns the new one.
//
// This function holds the mutex.
func (m *metricMap) getOrCreateMetricWithLabelValues(hash uint64, lvs []string, curry []curriedLabelValue,) Metric { // 返回了一个接口
	m.mtx.RLock()
	metric, ok := m.getMetricWithHashAndLabelValues(hash, lvs, curry)
	m.mtx.RUnlock()
	if ok {
		return metric
	}
	m.mtx.Lock()
	defer m.mtx.Unlock()
	metric, ok = m.getMetricWithHashAndLabelValues(hash, lvs, curry)
	if !ok {
		inlinedLVs := inlineLabelValues(lvs, curry)
		metric = m.newMetric(inlinedLVs...)
		m.metrics[hash] = append(m.metrics[hash], metricWithLabelValues{values: inlinedLVs, metric: metric})  // 这里写入 metricMap.metrics
	}
	return metric
}
// A Metric models a single sample value with its meta data being exported to
// Prometheus. Implementations of Metric in this package are Gauge, Counter,
// Histogram, Summary, and Untyped.
type Metric interface { // 哦哦哦哦,是接口啊。Gauge 实现这个接口
	// Desc returns the descriptor for the Metric. This method idempotently
	// returns the same descriptor throughout the lifetime of the
	// Metric. The returned descriptor is immutable by contract. A Metric
	// unable to describe itself must return an invalid descriptor (created
	// with NewInvalidDesc).
	Desc() *Desc
	// Write encodes the Metric into a "Metric" Protocol Buffer data
	// transmission object.
	//
	// Metric implementations must observe concurrency safety as reads of
	// this metric may occur at any time, and any blocking occurs at the
	// expense of total performance of rendering all registered
	// metrics. Ideally, Metric implementations should support concurrent
	// readers.
	//
	// While populating dto.Metric, it is the responsibility of the
	// implementation to ensure validity of the Metric protobuf (like valid
	// UTF-8 strings or syntactically valid metric and label names). It is
	// recommended to sort labels lexicographically. Callers of Write should
	// still make sure of sorting if they depend on it.
	Write(*dto.Metric) error
	// TODO(beorn7): The original rationale of passing in a pre-allocated
	// dto.Metric protobuf to save allocations has disappeared. The
	// signature of this method should be changed to "Write() (*dto.Metric,
	// error)".
}
看到这里就知道了写入、存储、读取已经连接到了一起。 同时如果没有显式的调用方法删除 metricMap.metrics 的内容,那么记录的 metrics 条目的值就会一直存在,而原生代码中只是创建和变更内部值。正是因为这个逻辑才导致上面说的事情。
既然找到原因,也找到对应的代码以及对应的内部逻辑,就清楚了 prometheus.GaugeVec 这个变量真正的使用方法。到此解决方案也就有了,找到合适的位置添加代码,显式调用 DeleteLabelValues 这个方法来删除无效 metrics 条目。
为了最后实现整体效果,我总结下有几个关键词:“异步”、“多次性使用”、“自动回收”。
最后的改造思路:
通过这个动作就可以实现自动回收和清理无效的 metrics 条目,最后验证下来确实有效。
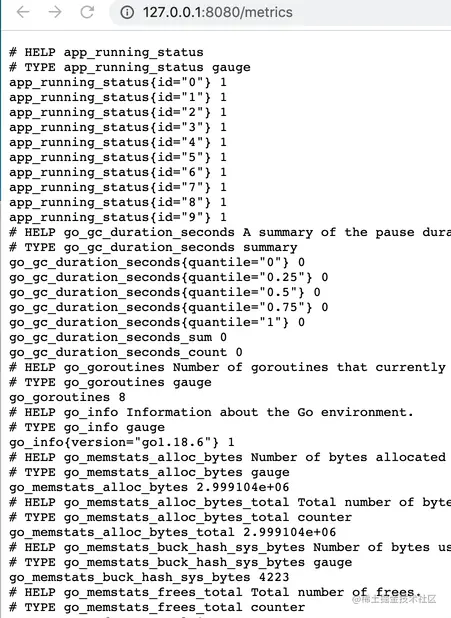
通过测试代码来验证这个方案的效果,具体如下演示:
package main
import (
	"context"
	"github.com/prometheus/client_golang/prometheus"
	"github.com/prometheus/client_golang/prometheus/promhttp"
	"net/http"
	"strconv"
	"sync"
	"time"
)
type metricsMetaData struct {
	UpdatedAt int64
	Labels    []string
}
func main() {
	var wg sync.WaitGroup
	var status sync.Map
	vec := prometheus.NewGaugeVec(
		prometheus.GaugeOpts{
			Namespace: "app",
			Name:      "running_status",
		}, []string{"id"},
	)
	prometheus.MustRegister(vec)
	defer prometheus.Unregister(vec)
	// 写入数据
	for i := 0; i < 10; i++ {
		labels := strconv.Itoa(i)
		vec.WithLabelValues(labels).Set(1)                                                            // 写入 metric 条目
		status.Store(labels, metricsMetaData{UpdatedAt: time.Now().Unix(), Labels: []string{labels}}) // 写入状态
	}
	// 创建退出 ctx
	stopCtx, stopCancel := context.WithCancel(context.Background())
	// 启动清理器
	go func(ctx *context.Context, g *sync.WaitGroup) {
		defer g.Done()
		ticker := time.NewTicker(time.Second * 2)
		for {
			select {
			case <-ticker.C:
				now := time.Now().Unix()
				status.Range(func(key, value interface{}) bool {
					if now-value.(metricsMetaData).UpdatedAt > 5 {
						vec.DeleteLabelValues(value.(metricsMetaData).Labels...) // 删除 metrics 条目
						status.Delete(key)                                       // 删除 map 中的记录
					}
					return true
				})
				break
			case <-(*ctx).Done():
				return
			}
		}
	}(&stopCtx, &wg)
	wg.Add(1)
	// 创建 http
	http.Handle("/metrics", promhttp.Handler())
	srv := http.Server{Addr: "0.0.0.0:8080"}
	// 启动 http server
	go func(srv *http.Server, g *sync.WaitGroup) {
		defer g.Done()
		_ = srv.ListenAndServe()
	}(&srv, &wg)
	wg.Add(1)
	// 退出
	time.Sleep(time.Second * 10)
	stopCancel()
	_ = srv.Shutdown(context.Background())
	wg.Wait()
}
结果动画: