性能度量目的是对学习期的泛华能力进行评估,性能度量反映了任务需求,在对比不同算法的泛华能力时,使用不同的性能度量往往会导致不同的评判结果。常用度量有均方误差,错误率与精度,查准率与查全率等。
这两种度量既适用于二分类任务,也适用于多分类任务。错误率是分类错误的样本数占样本总数的比例,精度则是分类正确的样本数占样本总数的比例。
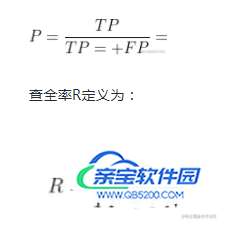
查准率(precision)与查全率(recall)是对于需求在信息检索、Web搜索等应用评估性能度量适应度高的检测数值。对于二分类问题,可将真实类别与算法预测类别的组合划分为真正例(ture positive)、假证例(false positive)、真反例(true negative)、假反例(false negative)四种情形。显然TP+FP+TN+FN=样例总数。分类结果为混淆矩阵:
      真实情况	                                  预测结果
            正例	                 反例
          正例	         TP(真正例)	           FN(假反例)
          反例	         FP(假正例)	           TN(真反例)
查准率P定义为:
一般来说。查准率高时,查全率往往偏低;而查全率高时,查准率往往偏低。通常只有一些简单任务中,才可能使查全率和查准率都很高。
import numpy
import matplotlib
from matplotlib import pyplot as plt
# true = [真实组1,真实组2...真实组N],predict = [预测组1,预测组2...预测组N]
def evaluation(true, predict):
    num = len(true)  # 确定有几组
    (TP, FP, FN, TN) = ([0] * num for i in range(4))  # 赋初值
    for m in range(0, len(true)):
        if (len(true[m]) != len(predict[m])):  # 样本数都不等,显然是有错误的
            print("真实结果与预测结果样本数不一致。")
        else:
            for i in range(0, len(true[m])):  # 对每一组数据分别计数
                if (predict[m][i] == 1) and ((true[m][i] == 1)):
                    TP[m] += 1.0
                elif (predict[m][i] == 1) and ((true[m][i] == 0)):
                    FP[m] += 1.0
                elif (predict[m][i] == 0) and ((true[m][i] == 1)):
                    FN[m] += 1.0
                elif (predict[m][i] == 0) and ((true[m][i] == 0)):
                    TN[m] += 1.0
    (P, R) = ([0] * num for i in range(2))
    for m in range(0, num):
        if (TP[m] + FP[m] == 0):
            P[m] = 0  # 预防一些分母为0的情况
        else:
            P[m] = TP[m] / (TP[m] + FP[m])
        if (TP[m] + FN[m] == 0):
            R[m] = 0  # 预防一些分母为0的情况
        else:
            R[m] = TP[m] / (TP[m] + FN[m])
    plt.title("P-R")
    plt.xlabel("P")
    plt.ylabel("R")
    #plt.plot(P, R)
    #plt.show()
if __name__ == "__main__":
    # 简单举例
    myarray_ture = numpy.random.randint(0, 2, (3, 100))
    myarray_predict = numpy.random.randint(0, 2, (3, 100))
    evaluation(myarray_ture,myarray_predict)
下面给出利用鸢尾花数据集绘制P-R曲线的代码(主要体现其微互斥性)
from sklearn import svm, datasets
from sklearn.model_selection import train_test_split
import numpy as np
iris = datasets.load_iris()
# 鸢尾花数据导入
x = iris.data
#每一列代表了萼片或花瓣的长宽,一共4列,每一列代表某个被测量的鸢尾植物,iris.shape=(150,4)
y = iris.target
#target是一个数组,存储了data中每条记录属于哪一类鸢尾植物,所以数组的长度是150,所有不同值只有三个
random_state = np.random.RandomState(0)
#给定状态为0的随机数组
n_samples, n_features = x.shape
x = np.c_[x, random_state.randn(n_samples, 200 * n_features)]
#添加合并生成特征测试数据集
x_train, x_test, y_train, y_test = train_test_split(x[y < 2], y[y < 2],
                                                    test_size=0.25,
                                                    random_state=0)
#根据此模型训练简单数据分类器
classifier = svm.LinearSVC(random_state=0)#线性分类支持向量机
classifier.fit(x_train, y_train)
y_score = classifier.decision_function(x_test)
from sklearn.metrics import precision_recall_curve
import matplotlib.pyplot as plt
precision, recall, _ =precision_recall_curve(y_test, y_score)
plt.fill_between(recall, precision,color='b')
plt.xlabel('Recall')
plt.ylabel('Precision')
plt.ylim([0.0, 1.0])
plt.xlim([0.0, 1.0])
plt.plot(recall, precision)
plt.title("Precision-Recall")
plt.show()
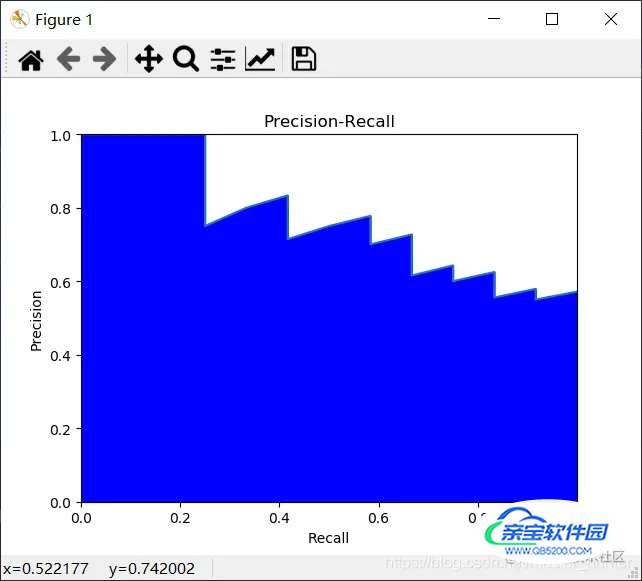
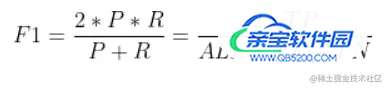
P-R图直观的显示出学习器在样本上的查全率、查准率。在进行比较时,若一个休息区的P-R曲线被另一个学习器的曲线完全“包住”,则可断言后者的性能优于前者。为取得比较合理的判断依据,将采用“平衡点”(Break-Even Point,BEP)度量对比算法的泛华性能强弱。它是“查准率=查全率”时的取值。但BEP还是过于简化,更常用F1度量(all为样例总数):