scikit-learn库
scikit-learn已经封装好很多数据挖掘的算法
现介绍数据挖掘框架的搭建方法
1.转换器(Transformer)用于数据预处理,数据转换
2.流水线(Pipeline)组合数据挖掘流程,方便再次使用(封装)
3.估计器(Estimator)用于分类,聚类,回归分析(各种算法对象)
所有的估计器都有下面2个函数
fit() 训练
用法:estimator.fit(X_train, y_train)
estimator = KNeighborsClassifier() 是scikit-learn算法对象
X_train = dataset.data 是numpy数组
y_train = dataset.target 是numpy数组
predict() 预测
用法:estimator.predict(X_test)
estimator = KNeighborsClassifier() 是scikit-learn算法对象
X_test = dataset.data 是numpy数组
示例
%matplotlib inline
# Ionosphere数据集
# https://archive.ics.uci.edu/ml/machine-learning-databases/ionosphere/
# 下载ionosphere.data和ionosphere.names文件,放在 ./data/Ionosphere/ 目录下
import os
home_folder = os.path.expanduser("~")
print(home_folder) # home目录
# Change this to the location of your dataset
home_folder = "." # 改为当前目录
data_folder = os.path.join(home_folder, "data")
print(data_folder)
data_filename = os.path.join(data_folder, "ionosphere.data")
print(data_filename)
import csv
import numpy as np
# Size taken from the dataset and is known已知数据集形状
X = np.zeros((351, 34), dtype='float')
y = np.zeros((351,), dtype='bool')


with open(data_filename, 'r') as input_file:
    reader = csv.reader(input_file)
    for i, row in enumerate(reader):
        # Get the data, converting each item to a float
        data = [float(datum) for datum in row[:-1]]
        # Set the appropriate row in our dataset用真实数据覆盖掉初始化的0
        X[i] = data
        # 1 if the class is 'g', 0 otherwise
        y[i] = row[-1] == 'g' # 相当于if row[-1]=='g': y[i]=1 else: y[i]=0
# 数据预处理
from sklearn.cross_validation import train_test_split
X_train, X_test, y_train, y_test = train_test_split(X, y, random_state=14)
print("训练集数据有 {} 条".format(X_train.shape[0]))
print("测试集数据有 {} 条".format(X_test.shape[0]))
print("每条数据有 {} 个features".format(X_train.shape[1]))
输出:
训练集数据有 263 条
测试集数据有 88 条
每条数据有 34 个features
# 实例化算法对象->训练->预测->评价
from sklearn.neighbors import KNeighborsClassifier

estimator = KNeighborsClassifier()
estimator.fit(X_train, y_train)
y_predicted = estimator.predict(X_test)
accuracy = np.mean(y_test == y_predicted) * 100
print("准确率 {0:.1f}%".format(accuracy))

# 其他评价方式
from sklearn.cross_validation import cross_val_score
scores = cross_val_score(estimator, X, y, scoring='accuracy')
average_accuracy = np.mean(scores) * 100
print("平均准确率 {0:.1f}%".format(average_accuracy))

avg_scores = []
all_scores = []
parameter_values = list(range(1, 21))  # Including 20
for n_neighbors in parameter_values:
    estimator = KNeighborsClassifier(n_neighbors=n_neighbors)
    scores = cross_val_score(estimator, X, y, scoring='accuracy')
    avg_scores.append(np.mean(scores))
    all_scores.append(scores)
输出:
准确率 86.4%
平均准确率 82.3%
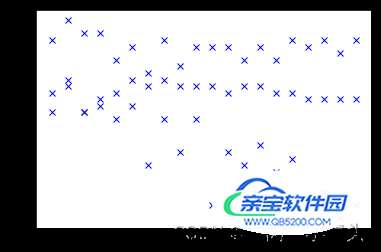
from matplotlib import pyplot as plt
plt.figure(figsize=(32,20))
plt.plot(parameter_values, avg_scores, '-o', linewidth=5, markersize=24)
#plt.axis([0, max(parameter_values), 0, 1.0])

for parameter, scores in zip(parameter_values, all_scores):
    n_scores = len(scores)
    plt.plot([parameter] * n_scores, scores, '-o')

plt.plot(parameter_values, all_scores, 'bx')
from collections import defaultdict
all_scores = defaultdict(list)
parameter_values = list(range(1, 21))  # Including 20
for n_neighbors in parameter_values:
    for i in range(100):
        estimator = KNeighborsClassifier(n_neighbors=n_neighbors)
        scores = cross_val_score(estimator, X, y, scoring='accuracy', cv=10)
        all_scores[n_neighbors].append(scores)
for parameter in parameter_values:
    scores = all_scores[parameter]
    n_scores = len(scores)
    plt.plot([parameter] * n_scores, scores, '-o')
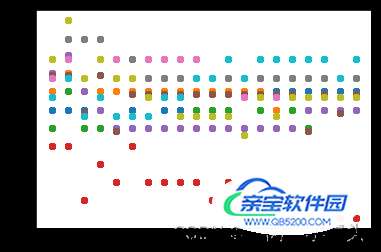
plt.plot(parameter_values, avg_scores, '-o')


