
# 邻接矩阵实现无向图 Dijkstra算法
inf = float("inf")


class Graph():
    def __init__(self, n):
        self.vertexn = n
        self.gType = 0
        self.vertexes = [inf]*n
        self.arcs = [self.vertexes*n]  # 邻接矩阵
        self.visited = [False]*n  # 用于深度遍历记录结点的访问情况

    def addvertex(self, v, i):
        self.vertexes[i] = v

    def addarcs(self, row, column, weight):
        self.arcs[row][column] = weight

    # 深度优先遍历
    def DFS(self, i):
        j = 0
        print("vertex:{}".format(self.vertexes[i]), end=" ")  # 先打印访问到的节点
        self.visited[i] = True
        while j < self.vertexn:
            if (self.arcs[i][j] != inf) and (not self.visited[j]):
                print(self.arcs[i][j], end=" ")
                self.DFS(j)
            j += 1

    # 广度优先遍历
    def BFS(self, k):
        self.visited = [False]*self.vertexn  # 访问性重置
        q = []
        print("vertex:{}".format(self.vertexes[k]), end=" ")
        self.visited[k] = True
        q.append(k)
        while q != []:
            i = q.pop(0)
            for j in range(self.vertexn):
                if(self.arcs[i][j] != inf) and (not self.visited[j]):
                    print(self.arcs[i][j], end=" ")  # 父节点与子节点的距离
                    print("vertex:{}".format(self.vertexes[j]), end=" ")
                    self.visited[j] = True
                    q.append(j)

    # 最短路径算法-Dijkstra 输入点v0,找到所有点到v0的最短距离
    def Dijkstra(self, v0):
        # 初始化操作
        D = [inf]*self.vertexn  # 用于存放从顶点v0到v的最短路径长度
        path = [None]*self.vertexn  # 用于存放从顶点v0到v的路径
        final = [None]*self.vertexn  # 表示从v0到v的最短路径是否找到最短路径
        for i in range(self.vertexn):
            final[i] = False
            D[i] = self.arcs[v0][i]
            path[i] = ""  # 路径先置空
            if D[i] < inf:
                path[i] = self.vertexes[i]  # 如果v0直接连到第i点,则路径直接改为i
        D[v0] = 0
        final[v0] = True
        ###
        for i in range(1, self.vertexn):
            min = inf  # 找到离v0最近的顶点
            for k in range(self.vertexn):
                if(not final[k]) and (D[k] < min):
                    v = k
                    min = D[k]
            final[v] = True  # 最近的点找到,加入到已得最短路径集合S中 此后的min将在处S以外的vertex中产生
            for k in range(self.vertexn):
                if(not final[k]) and (min+self.arcs[v][k] < D[k]):
                    # 如果最短的距离(v0-v)加上v到k的距离小于现存v0到k的距离
                    D[k] = min+self.arcs[v][k]
                    path[k] = path[v]+","+self.vertexes[k]
        return D, path


if __name__ == "__main__":
    g = Graph(5)
    g.vertexes = ["A", "B", "C", "D", "E"]
    g.arcs = [[inf, 60, 80, 30, inf], [60, inf, 40, 75, inf], [
        80, 40, inf, inf, 35], [30, 75, inf, inf, 45], [inf, inf, 35, 45, inf]]

    print("深度优先遍历:")
    g.DFS(0)
    print("\n广度优先遍历:")
    g.BFS(0)
    print()

    print("Dijkstra搜索点到图中各点的最短路径:")
    D, path = g.Dijkstra(0)
    print(D)
    print(path)
利用networkx,numpy,matplotlib,将邻接矩阵输出为图形。
1,自身确定一个邻接矩阵,然后通过循环的方式添加变,然后输出图像
import networkx as nx
import matplotlib.pyplot as plt
import numpy as np

G = nx.Graph()
Matrix = np.array(
    [
        [0, 1, 1, 1, 1, 1, 0, 0],  # a
        [0, 0, 1, 0, 1, 0, 0, 0],  # b
        [0, 0, 0, 1, 0, 0, 0, 0],  # c
        [0, 0, 0, 0, 1, 0, 0, 0],  # d
        [0, 0, 0, 0, 0, 1, 0, 0],  # e
        [0, 0, 1, 0, 0, 0, 1, 1],  # f
        [0, 0, 0, 0, 0, 1, 0, 1],  # g
        [0, 0, 0, 0, 0, 1, 1, 0]  # h
    ]
)
for i in range(len(Matrix)):
    for j in range(len(Matrix)):
        G.add_edge(i, j)

nx.draw(G)
plt.show()
2,有向图
G = nx.DiGraph()
G.add_node(1)
G.add_node(2)
G.add_nodes_from([3, 4, 5, 6])
G.add_cycle([1, 2, 3, 4])
G.add_edge(1, 3)
G.add_edges_from([(3, 5), (3, 6), (6, 7)])
nx.draw(G)
# plt.savefig("youxiangtu.png")
plt.show()
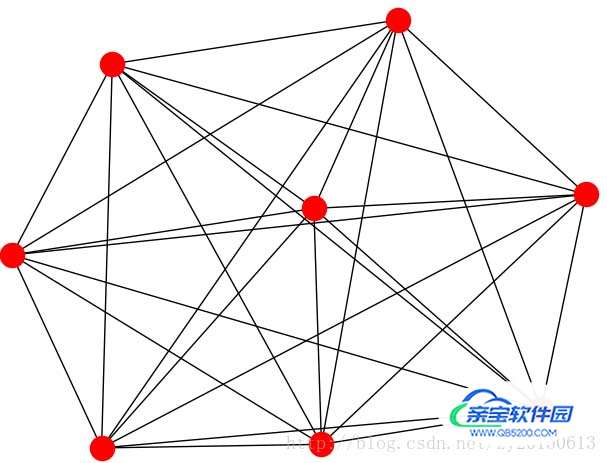
3,5节点完全图
G = nx.complete_graph(5)
nx.draw(G)
plt.savefig("8nodes.png")
plt.show()
4,无向图
G = nx.Graph()
G.add_node(1)
G.add_node(2)
G.add_nodes_from([3, 4, 5, 6])
G.add_cycle([1, 2, 3, 4])
G.add_edge(1, 3)
G.add_edges_from([(3, 5), (3, 6), (6, 7)])
nx.draw(G)
# plt.savefig("wuxiangtu.png")
plt.show()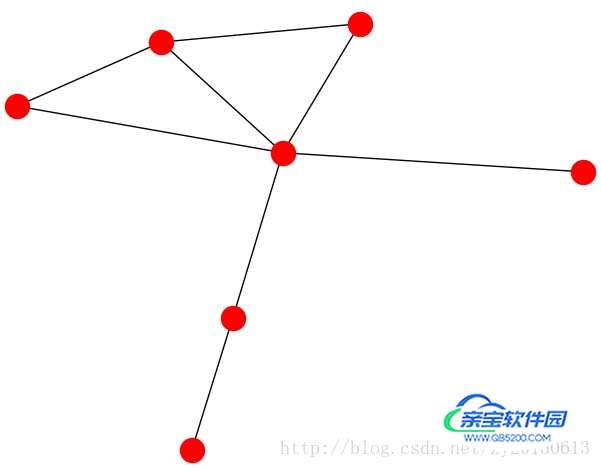
5,颜色节点图
G = nx.Graph()
G.add_edges_from([(1, 2), (1, 3), (1, 4), (1, 5), (4, 5), (4, 6), (5, 6)])
pos = nx.spring_layout(G)

colors = [1, 2, 3, 4, 5, 6]
nx.draw_networkx_nodes(G, pos, node_color=colors)
nx.draw_networkx_edges(G, pos)

plt.axis('off')
# plt.savefig("color_nodes.png")
plt.show()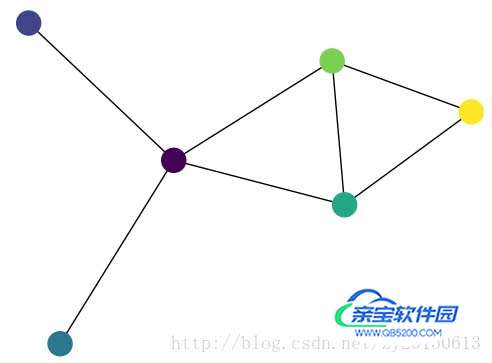
将图转化为邻接矩阵,再将邻接矩阵转化为图,还有图的集合表示,邻接矩阵表示,图形表示,这三种表现形式互相转化的问题是一个值得学习的地方。
以上为个人经验,希望能给大家一个参考,也希望大家多多支持。

