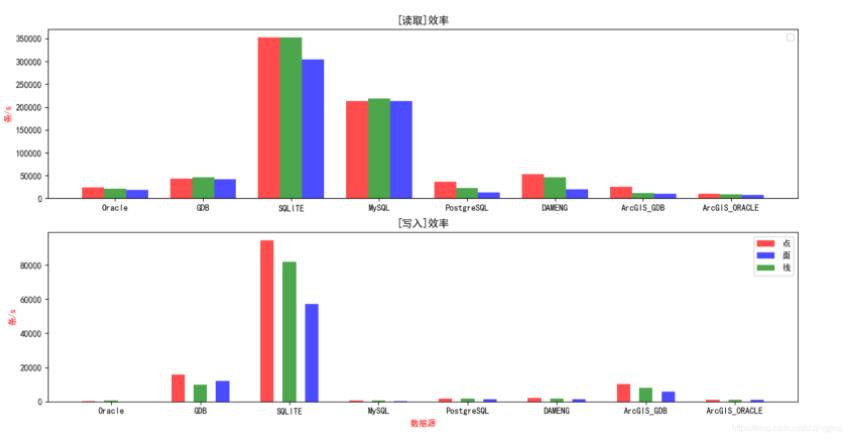
首先放效果图:
 # -*- coding: utf-8 -*-
import numpy as np

import tensorflow as tf
from matplotlib.path import Path
from matplotlib.patches import PathPatch
import matplotlib.pyplot as plt
import matplotlib
from matplotlib.animation import FuncAnimation
import matplotlib as mpl
import datetime
import time
import  re
import urllib.request
np.set_printoptions(suppress=True)

mpl.rcParams['font.sans-serif'] = ['SimHei'] #指定默认字体 SimHei为黑体
mpl.rcParams['axes.unicode_minus'] = False #用来正常显示负
import requests
import re
import hashlib

#测试数据  osm的点线面数据
#测试主机 8G 4核 1T机械盘
#mysql 5.7.23
#postgresql 12
#dameng 7
#oracle 19c 19.3


#读取效率 点             线           面
r = [     [24714,       21748,        19298],     #Oracle
          [44127,       45943,        42199],     #GDB
          #[0,      0,        0],    #SQLITE
         # [0,      0,        0],    #MySQL
          [352641,      352739,        304189],    #SQLITE
          [213550,      218095,        212749],    #MySQL
          [36556,       22172,        12741],     #PostgreSQL
          [52749,       46292,        20040],     #dameng
          [25111,       12000,        11000],     #ArcGIS_GDB
          [10102,       9003,        7003]       #ArcGIS_ORACLE
     ]
 #写入效率
w = [     [190,         675,        40],        #Oracle
          [15815,       9820,        11892],     #GDB
          [94547,       81847,        57235],     #SQLITE
          # [0,       0,        0],     #SQLITE
         [502,         662,        403],       #MySQL
          #[0,         0,        0],       #MySQL
          [1631,        1599,        1502],      #PostgreSQL
          [2004,        1849,        1524],      #dameng
          [10111,       8000,        5600] ,     #ArcGIS_GDB
          [1100,       1000,        900]        #ArcGIS_ORACLE
    ]
#这是柱图x轴标签
ysr = ['Oracle','GDB','SQLITE','MySQL','PostgreSQL','DAMENG','ArcGIS_GDB','ArcGIS_ORACLE']


def DrawGeoDtaabse(rcount, wcount, y):
    #第一行 第一列图形   2,1 代表2行1列
    ax1 = plt.subplot(2,1,1)
    #第二行 第一列图形
    ax3 = plt.subplot(2,1,2)
    #默认时间格式
    plt.sca(ax1)
    plt.xlabel("",color = 'r') #X轴标签
    plt.ylabel("条/s",color = 'r')  #Y轴标签
    #plt.grid(True)   显示格网
    #plt.gcf().autofmt_xdate() 显示时间
    plt.legend() # 显示图例
    plt.title("[读取]效率") #标题

    x1 = [1,5,9,13,17,21,25,29] # x轴点效率位置
    x2 = [i + 1 for i in x1]    # x轴线效率位置
    x3 = [i + 2 for i in x1]    # x轴面效率位置
    y1 = [i[0] for i in rcount] # y轴点效率位置
    y2 = [i[1] for i in rcount] # y轴线效率位置
    y3 = [i[2] for i in rcount] # y轴面效率位置
    #占位以免 数据源标签丢失
    y0 = ["","","","","","","",""]
    plt.bar(x1, y1, alpha=0.7, width=1, color='r',label="点", tick_label=y0)
    plt.bar(x3, y3, alpha=0.7, width=1, color='b',label="面", tick_label=y0)
    plt.bar(x2, y2, alpha=0.7, width=1, color='g',label="线", tick_label=y)
    #至此第一行的读取效率绘制完毕,再重复一下第二行的写效率

    plt.sca(ax3)
    plt.xlabel("数据源",color = 'r') #X轴标签
    plt.ylabel("条/s",color = 'r') #Y轴标签
    #plt.grid(True)
    plt.legend() # 显示图例
    plt.title("[写入]效率") #图标题


    y1 = [i[0] for i in wcount]
    y2 = [i[1] for i in wcount]
    y3 = [i[2] for i in wcount]
    y0 = ["","","","","","","",""]
    plt.bar(x1, y1, alpha=0.7, width=0.6, color='r',label="点", tick_label=y0)
    plt.bar(x3, y3, alpha=0.7, width=0.6, color='b',label="面", tick_label=y0)
    plt.bar(x2, y2, alpha=0.7, width=0.6, color='g',label="线", tick_label=y)

    plt.legend()
    plt.show()

DrawGeoDtaabse(r,w,ysr)
以上所有代码在python3.6.4上运行测试成功

